- 10
- March
On February 28, 2026, the US and Israel launched strikes against Iran, leading Iran to close the Strait of Hormuz — the bottleneck handling 20% of the world's oil — pushing Brent crude past $114 per barrel, the highest in 4 years. The question every executive is asking: "Costs have risen — how much should I raise prices?" This article answers that question with practical cost forecasting techniques.
Quick Summary: The oil crisis affects costs in 3 ways — transport, raw materials, and energy. Businesses that don't know their true costs will "guess" new selling prices incorrectly. This article teaches Cost Breakdown, What-if Analysis, and Forecasting techniques to price with data-backed confidence.
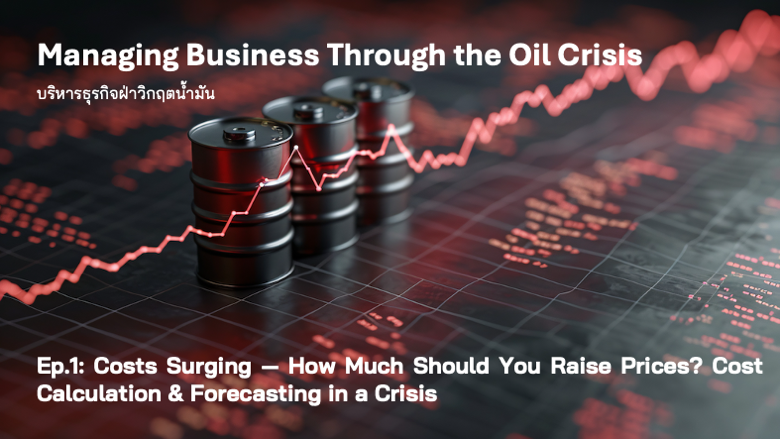
Series: Navigating Business Through the Oil Crisis — EP.1 Costs Surging — How Much to Raise Prices? | EP.2 Supply Chain Disruption | EP.3 Don't Let Cash Flow Stall | EP.4 Strategic Planning Through the Crisis
Current Situation — How Much Is Oil Impacting Thai Businesses?
Thailand imports over 30 million barrels of oil per month. Every $10 rise per barrel immediately adds $300 million per month in import costs — and the impact doesn't stop at oil. It cascades into every related cost.
| Affected Costs | Real Figures (Mar 2026) | Hardest-Hit Businesses |
|---|---|---|
| Sea Freight Costs | Freight + insurance up 50-140% | Exports, raw material imports, food |
| Domestic Transport Costs | Diesel adjusted per global market prices | Logistics, retail, construction |
| Imported Raw Material Costs | Steel, plastic, chemicals rise with petrochemicals | Manufacturers, factories, construction |
| Factory Energy Costs | Electricity + industrial gas adjusted per LNG | All factory types |
| Packaging Costs | Plastic, foam, cardboard boxes rise with energy | Food, beverages, e-commerce |
SCB EIC Assessment: If the conflict escalates and Iran closes the Strait of Hormuz for 2–6 weeks, oil could surge past $107/barrel (it already has). This could slow Thailand's 2026 economy by 0.3–0.8%, with inflation rising by 0.8% for every $10 increase in oil prices.
The Core Problem — Why Do Many Businesses "Guess" New Selling Prices Incorrectly?
When costs surge, most executives ask their accounting team "How much have costs risen?" — but the answers they typically get are:
- "We only know the total — not how much each product is affected" — because they've never done a per-product Cost Breakdown
- "We can only tell you last month's figures, not this month's" — because they close accounts periodically and must wait until month-end
- "We don't know how much each product's cost rises when oil goes up 20%" — because they've never done a What-if Analysis
- "Let's just raise prices 10% for now" — a number based on guessing, not data
Businesses that set prices by "guessing" risk two types of problems:
| Scenario | Consequence |
|---|---|
| Pricing too low | Margin shrinks, selling at a loss without realizing it, profits erode gradually until it's too late |
| Pricing too high | Customers flee to competitors, sales disappear, market share lost that's hard to recover |
Both arise from the same root cause — not knowing your true costs — which is covered in detail in our article The True Cost of Manufacturing — How to Find It When You've Never Done Perpetual Costing.
Step 1: Cost Breakdown — Itemize Costs Clearly
Before knowing how much to raise prices, you must first break down your product costs into components to see which parts oil is impacting and by how much:
Example: Domestically produced goods, selling price 1,000 baht
| Cost Component | Before Crisis | % of Selling Price | Affected by Oil? |
|---|---|---|---|
| Direct Materials | 350 THB | 35% | If imported = heavily affected / If domestic = partially affected |
| Direct Labor | 150 THB | 15% | No direct impact (short-term) |
| Energy/Utilities | 80 THB | 8% | Fully impacted — electricity, gas |
| Transportation (Inbound + Outbound) | 70 THB | 7% | Fully impacted — diesel + freight charges |
| Other Overhead | 100 THB | 10% | Partial (petrochemical-based packaging) |
| Total Cost | 750 THB | 75% | — |
| Gross Margin | 250 THB | 25% | — |
From the table, costs directly impacted by oil = Energy (80) + Transport (70) = 150 THB, or 15% of the selling price. Including partially affected imported materials, total impact could reach 20–25%.
Step 2: What-if Analysis — If Oil Rises X%, What Will Costs Be?
Once you know which components are affected, the next step is to simulate scenarios — if oil rises 20%, 40%, or 60%, how much will costs change? This is the core of preventing budget overruns.
| Scenario | Oil Price (Brent) | Energy + Transport Increase | New Total Cost | Remaining Margin |
|---|---|---|---|---|
| Before Crisis | $75/barrel | — | 750 THB | 25.0% |
| Scenario A: Oil +20% | $90/barrel | +30 THB | 780 THB | 22.0% |
| Scenario B: Oil +50% | $112/barrel | +75 THB | 825 THB | 17.5% |
| Scenario C: Oil +80% | $135/barrel | +120 THB | 870 THB | 13.0% |
We are currently at Scenario B (Brent ~$114) — Margin has dropped from 25% to 17.5%. Without a price increase, gross profit disappears by 75 THB per unit.


Step 3: Cost Forecasting Techniques — Look Ahead, Not Just Behind
Knowing what costs "are" isn't enough — executives need to know what costs "will be" in the next 1–3 months to price proactively. Here are practical forecasting techniques:
Technique 1: Cost Driver Mapping
Identify what "drives" each cost component, then track those drivers instead:
| Cost Component | Cost Driver | Sources to Track |
|---|---|---|
| Transport costs | Diesel price + Freight rates (BDI) | EPPO (Energy Policy & Planning Office), Freightos Baltic Index |
| Energy costs | Brent price + Ft electricity rate | EIA, NERC (National Energy Regulatory Commission) |
| Imported raw materials | World market prices + Exchange rates | LME (metals), ICIS (chemicals), BOT (exchange rates) |
| Packaging | Petrochemical feedstock prices | Platts, ICIS Petrochemical Index |
Technique 2: Rolling Forecast
Instead of doing a budget once a year and holding to those numbers, use a Rolling Forecast — updating estimates every 1–3 months based on actual data:
- Month 1: Collect actual cost data, compare against budget
- Month 2: Adjust estimates for months 3–6 based on real trends
- Month 3: Revise again + extend the horizon by another 3 months
This approach gives executives forward visibility rather than just looking at past numbers — consistent with the principles of budget reconciliation with accounting.
Technique 3: Sensitivity Analysis
Calculate how much a single-factor change impacts profit:
Example Sensitivity Analysis:
- Every $10/barrel oil increase → cost per unit rises by 15 THB → Margin drops by 1.5%
- Every 1 THB/USD baht depreciation → imported raw material costs increase by ~3%
- 50% increase in sea freight → transport cost increases by 35 THB/unit
Once you know your Sensitivity, executives can set Trigger Points — e.g., "If oil exceeds $120 we must adjust prices immediately" or "If the baht weakens past 38 we need to hedge currency."
Step 4: Setting New Selling Prices — Backed by Data
Once you know your true costs, scenarios, and forecasts, the final step is deciding how much to raise prices — using one of 3 strategies:
| Strategy | Method | Suitable for | Risk |
|---|---|---|---|
| Full Pass-through | Pass all cost increases on to the selling price | Essential goods, few competitors | Customers flee if alternatives exist |
| Partial Absorption | Absorb part of the cost increase, pass part to price | Highly competitive markets, customer retention needed | Temporary margin compression |
| Value Re-engineering | Redesign product/service to reduce costs without losing value | Businesses with R&D capability or flexibility | Takes time, not an immediate solution |
Real Example: Product costs 750 THB, sells for 1,000 THB (Margin 25%)
After the crisis, costs rise by 75 THB = 825 THB total
Full Pass-through: Raise price to 1,075 THB (Margin returns to 23.3%)
Partial Absorption: Raise price to 1,040 THB + absorb 35 THB (Margin 20.7%)
Value Re-engineering: Cut packaging costs by 20 THB + raise price 55 THB → sell at 1,055 THB (Margin 23.7%)
What Other Context Must Executives Consider?
Pricing decisions can't be based on costs alone — executives must consider the full context, covered in upcoming episodes of this series:
| Context to Consider | Key Questions | Read More In |
|---|---|---|
| Supply Chain | Can suppliers still deliver? How much has lead time increased? Do you have backup suppliers? | EP.2 |
| Cash Flow | Do you have enough cash to pay suppliers at higher costs? Can you still manage credit terms? | EP.3 |
| Competitors | Have competitors raised prices yet? If you raise first, where will customers go? | EP.4 |
| Customers | Which customer segment is price-sensitive? Raise all prices or selectively? | EP.4 |
| Government Policy | Will the government subsidize energy costs? Are there SME assistance measures? | EP.4 |
| Exchange Rate | Is the baht weakening or strengthening — compounding or reducing costs? | EP.3 |
How Does ERP Help with This?
Every step described above — Cost Breakdown, What-if Analysis, Forecast, Sensitivity Analysis — requires accurate, precise, and timely data, which ERP does far better than Excel:
| What Needs to Be Done | Excel | ERP |
|---|---|---|
| Per-product Cost Breakdown | Must manually key data from multiple sources, error-prone | Pulled automatically from BOM + Routing + Purchases |
| What-if Analysis | Possible but requires manual data updates | Adjust variables and simulate instantly |
| Margin Monitoring | Only known at month-end (too late) | Real-time visibility on every order, every day |
| Rolling Forecast | Time-consuming to create and update | Generated from existing actuals, quickly adjusted |
| Price List Update | Must update item by item, easy to miss | Update central Price List, applied to all orders immediately |
| Alert When Margin Falls Below Threshold | None — must check manually | Automated alerts notify executives immediately |
For a broader view of risk management, see our Risk Management article for additional frameworks.
Note: Saeree ERP includes Costing, Budgeting, and Financial Reporting modules that support comprehensive Cost Breakdown, Standard Cost, and Variance Analysis. An AI Assistant is currently in development (Training phase), which will eventually enable automated cost trend analysis — the Forecasting in this article refers to using ERP data with the analysis methods described above.
Summary — Executive Checklist
| Do Now (Today) | Do with ERP |
|---|---|
| Do Cost Breakdown for your top 10 products | Automated Cost Breakdown for all products |
| Run What-if 3 Scenarios in Excel | Simulate instantly — adjust variables and see results immediately |
| Track Cost Drivers weekly | Real-time Margin Dashboard + Automated Alerts |
| Set Trigger Points for price adjustments | System alerts when Margin drops below threshold |
| Do Rolling Forecast every 2 weeks | Rolling Forecast from Actuals updated daily |
In a crisis, the businesses that survive are not the largest — they are the ones that know their numbers fastest. Know your true costs, know your real margins, then make decisions from data, not instinct.
- Saeree ERP Team
Read more EP.2: Supply Chain Disruption — What to Adjust? Emergency Procurement Plans and Risk Distribution
References
- Al Jazeera — Iran war threatens prolonged impact on energy markets
- Morgan Stanley — Iran Conflict: Oil Price Impacts and Inflation
- TDRI — Thai Economy and Trump Tariffs: What Risks Await in 2026
- spacebar.th — 60-Day Oil Reserve: The Hormuz Crisis in the Shadow of War
- InfoQuest — Industry Minister Orders 4 Emergency Measures